If you’ve been wondering how to teach the several types of maps that your students need to know, you’re in the right place!
Ever since the existence of man, we have had maps. There have been many changes to maps due to political perspectives and upgrades in technology, but maps have remained an essential tool for survival throughout history.
As students move through school, they’ll be faced with a variety of maps. Arming them with the ability to read maps is time well spent in the upper elementary grades.
There are five basic varieties of maps: political, physical, historical, resource/product, and climate. Once students are proficient with these five map types, they’ll undoubtedly be able to read any other type of map that they encounter.
Are you looking for more upper elementary social studies/writing resources and ideas? I’d love for you to join my weekly VIP email club with no spam, just helpful tips, ideas, and resources!
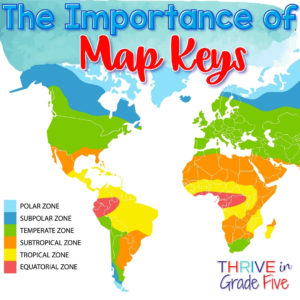
The Importance of Map Keys
I tell my students that the map key is the most important part of the map.
The map key is essential because it explains what any symbols, colors, shapes, or patterns mean on the map.
I help students to understand that most maps are worthless without a key.
To demonstrate this fact, I put a map in front of students and cover the map key. Then, I ask questions about the map that are impossible to answer without knowing what the colors/symbols/shapes/patterns on the map represent.
On each of the following map types, the key is the first thing students need to locate!
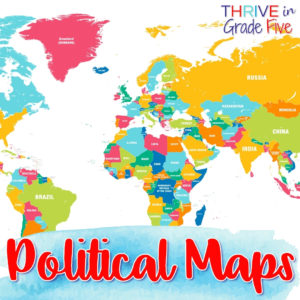
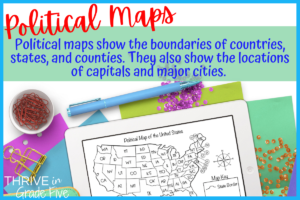
Political Maps
Political maps show the boundaries of countries, states, and counties. They also show the locations of capitals and major cities.
Often, political maps use colors to help readers differentiate between locations on the map.
When teaching political maps, you should emphasize to students that the borders on these maps are never permanent and sometimes borders change, especially with large upheavals in politics and leadership.
When I was a student myself, there were a couple of European countries whose names changed, so the maps in our textbook didn’t match the updated maps our teacher printed out for us. We were mind blown! 🙂
It’s important to note that political maps can “zoom out” and show the countries on a continent, states in a nation, or states in a region.
Political maps can also “zoom in” to show the cities in a state or the borders of suburbs surrounding a large city.
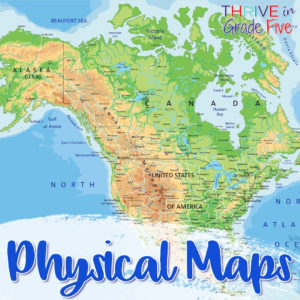
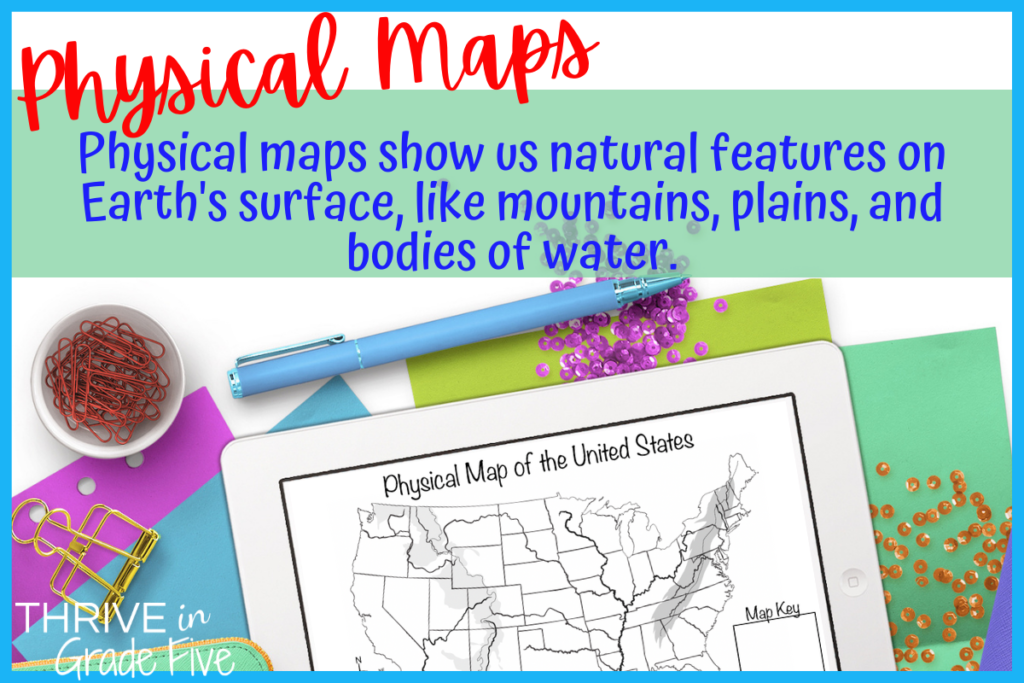
Physical Maps
Physical maps show us natural features on Earth’s surface, like mountains, plains, and bodies of water.
Additionally, physical maps can provide information about the topography of a place, including deserts and other identifiable landforms.
Cartographers (mapmakers) often utilize colors and hues to show various physical features on a map.
Physical maps may also use lines to indicate changes in elevation. The closer the lines, the more drastic the elevation change.
Often, physical maps are used by pilots to show when to fly to higher elevations to avoid crashing into physical features, like mountains.
It is common for students to use physical maps to learn more about world regions and environments.
I clearly remember using salt dough to make physical maps as an upper elementary student myself. Oh, the mess!
If you are going to have your students create three-dimensional physical maps, I recommend Play-Doh. Just scoop it out of the can and it’s ready to go. We do this outdoors in our school’s covered pavilion so that Play-Doh specks are not ground into the classroom carpet.
* Please note that Thrive in Grade Five (Jenifer Bazzit) is a participant in the Amazon Services LLC Associates Program, an affiliate advertising program designed to provide a means for sites to earn advertising fees by advertising and linking to amazon.com. *
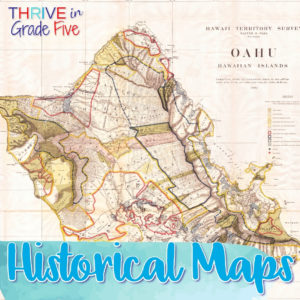
Historical Maps
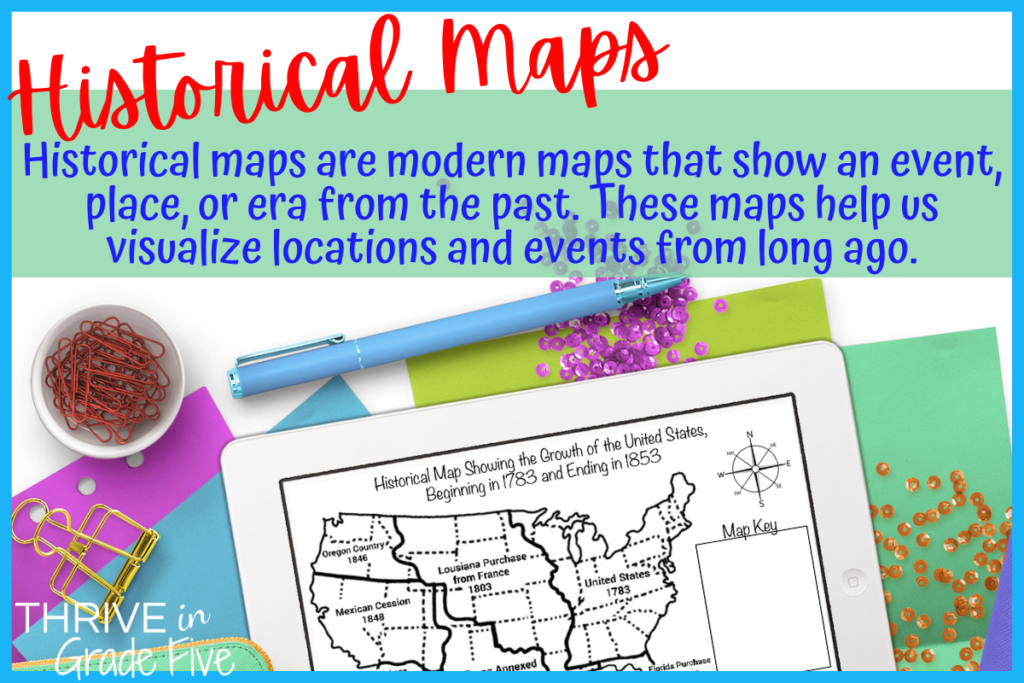
Historical maps are modern maps that show an event, place, or era from the past. These maps help us visualize locations and events from long ago.
A historical map can show multiple aspects of history: migration patterns, ancient boundaries, political changes, battles, and more.
Also, this type of map might be used when completing academic or family (genealogical) research.
Maps are an important part of our social studies instruction. For example, when studying the American Revolution, we discuss General Washington’s choice of Valley Forge as the Continental Army’s winter encampment.
Valley Forge was the perfect location for the encampment because it was close to the city of Philadelphia and it was easily defendable due to the geography of the land.
My students leave the lesson with a deeper understanding of the choices made during the American Revolution because they used a historical map to learn some of the details.
Resource/Product Maps
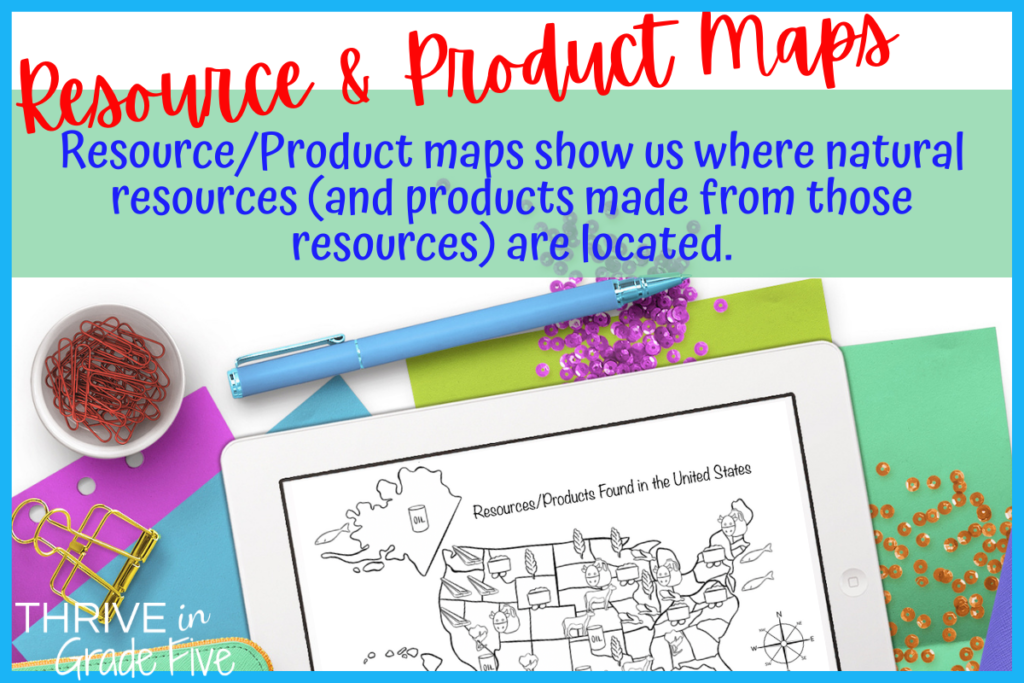
Resource maps, also called product maps, show us where natural resources (and the products made from those resources) are located.
These maps are a fantastic way to analyze the locations of resources. For example, why might we see large numbers of livestock located in flat, grassy areas? Why might another region be rich in mineral resources?
In our global economy, it’s important that students recognize that most of what we consume is not produced locally, but instead might travel to us from across the world.
My students enjoy creating these maps because they love to draw pictures to represent various resources and products.
This is a type of map for which a map key is absolutely essential, so be sure to emphasize the creation of a clear map key when students make their own resource/product maps.
Climate Maps
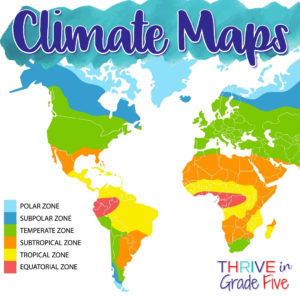
Climate maps show us what the weather in a place has been like for a very long period of time, like decades or centuries.
First, students must understand that climate and weather are different.
Daily weather tells us what is happening outside right now. Climate is an average of weather conditions for many, many years.
Climate maps can help students to understand different climates zones around the world and the impact of those climates on animals, plants, people, and politics.
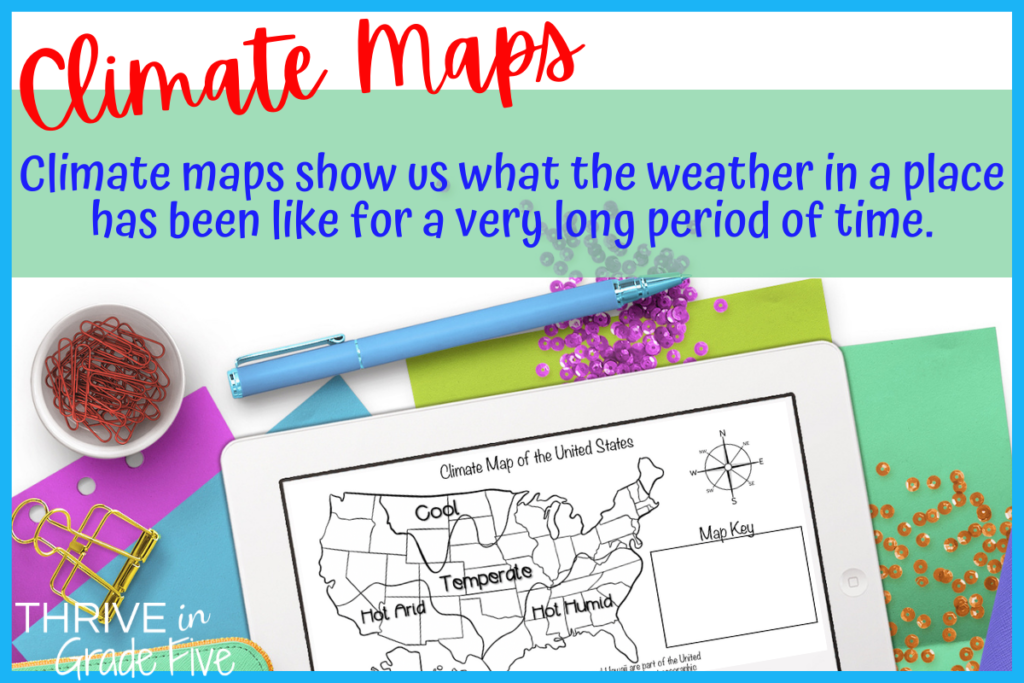
Climate maps are a great way to integrate social studies and science because these maps often include scientific concepts, like temperature, precipitation, relative humidity, wind speed and direction, and more.
Something I like to do with my students: When there is bad weather coming into my state, like an ice storm risk or tornado risk day, we examine the weather forecast maps that are readily available on all of the news station websites.
This leads to an engaging discussion about the differences between weather and climate and how there are sometimes weather events that may not match the long-term climate designations of a place.
Activity Ideas
Textbook Scavenger Hunt
I don’t use textbooks in my classroom but I do have an old set of textbooks on my shelf. To prepare for this activity, you’ll need to look through the textbook to get an idea for yourself about where the examples of each type of map are located.
Then, you’ll place students into pairs and have them flip through a textbook and write down the page number(s) where they can find political maps, historical maps, and etc.
This is a good exit ticket/quick grade assignment.
Some of your bright students will realize that they can look in the index and they’ll usually find mention of each type of map but I certainly don’t share that information with them ahead of time.
One Location, Five Maps Activity
Students can put their new map knowledge to good use by creating a series of maps for one location.
I love this project because I can make it as simple or as detailed as my classroom time allows.
My students create and name an imaginary country, state, or city and draw its borders.
Then, they create five maps for their imaginary place: a political map, physical map, climate map, historical map, and resource/product map.
Be sure to have them review the use and requirements of each type of map before starting this project.
If you’d enjoy having the ready-to-use printables and grading sheet that go along with this type of project, check out the resource below. 🙂
Looking for a ready-to-print resource that will help you teach all five types of maps stress free? This resource contains instructional pages, practice pages, a Marvelous Maps Project, and a maps quiz.
Are you looking for more upper elementary social studies/writing resources and ideas? I’d love for you to join my weekly VIP email club with no spam, just helpful tips, ideas, and resources!